Do you need a quick and easy way to stay on top of your tasks and sales opportunities? Are you a manager who needs to track the progress of deals and motivate your team to reach targets? Act!’s interactive dashboard brings all your business information together in a comprehensive, graphical view to help you and your team manage tasks and progress to meet your sales targets. You get an at-a-glance view of key Act! information like Activities and Opportunities while allowing you to drill down into this information and take further action directly from the dashboard, so you can start your day effectively and work more efficiently.
For Individuals: The Act! Dashboard can be easily configured to deliver appropriate activity and opportunity information for an individual user.
For Teams: The Act! Dashboard also provides information for all users in a team, enabling you as a manager to get the information you need to quickly set team targets, gauge performance status and report on results. The Dashboard helps to motivate your sales team as they can easily see the prospect of closing deals and converting leads into wins.
Let’s take a closer look at how you could benefit from the information presented in each of the dashboard components.
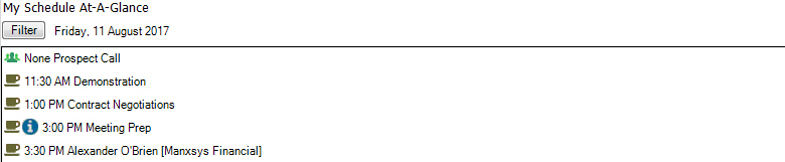
1. My Schedule at a Glance
Start your day with the ‘My Schedule at a Glance’ component and view a list of activities scheduled including Activity Type and time for the current day, helping to ensure important calls, meetings and to-do’s don’t slip through the cracks. You can drill down into any scheduled activity for more detail or to take further action and schedule, clear or add additional details.
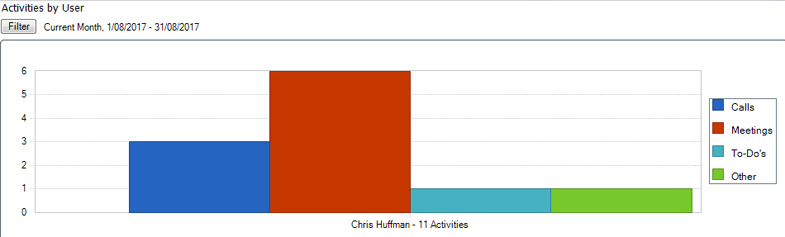
2. Activities by User
For more information on your activities, the ‘Activities by User’ component provides you with a complete view of scheduled activities and allows you to see how time is allocated to each for a given date range so you can easily determine the amount of time your team is spending on phone calls, in meetings and on tasks.
For deeper analysis you can filter by Activity type, priority, private/public, timeless, cleared and even Outlook tasks. As a manager, use this component to provide direction to underperforming users by comparing ‘Activities by User’ data to ‘Opportunity by User’ data and draw parallels between activities and results.
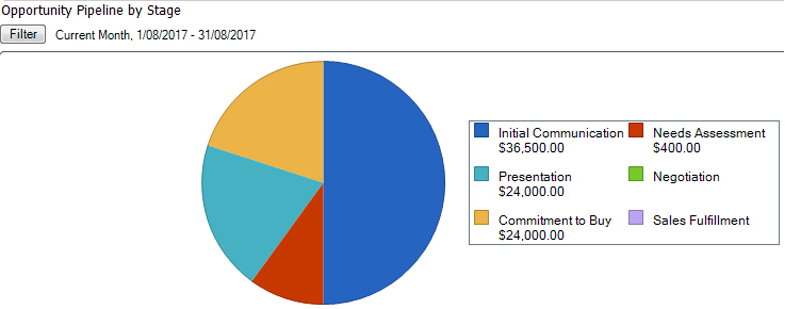
3. Opportunity Pipeline by Stage
For details on your sales opportunities, utilise the ‘Opportunity Pipeline by Stage’ component to see how sales opportunities are tracking for a given date range. Whether you’re using the Act! Sales process or a customised process, you will know exactly the type of attention each of these opportunities need. You can get a quick count of all opportunities associated with each stage. As a manager, view the number of opportunities and potential revenue associated within each stage for specific users or the entire team.
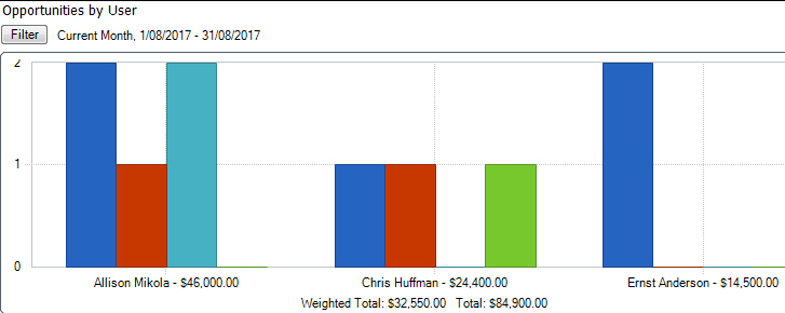
4. Opportunities by User
The ‘Opportunities by User’ component provides you with overarching view of sales opportunities of each user for a given date range so you can easily determine how your sales are tracking. For deeper analysis you can filter by date range, status, process, stage, probability and total. As a manager, you can use this component to easily compare performance across the team.
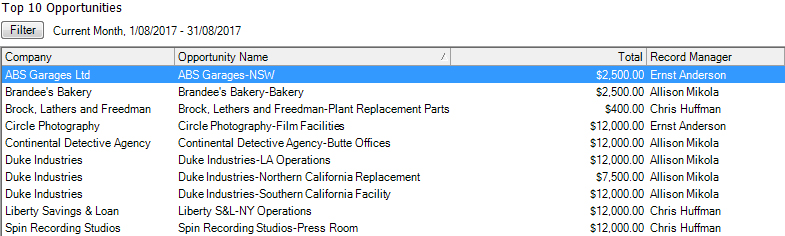
5. Top 10 Opportunities
Utilise the ‘Top 10 Opportunities’ component for a list of top sales opportunities for a given date range to hone in on opportunities most valuable to your pipeline. You can sort each column in the list by company, opportunity name, total and Record Manager for easy referencing. Even drill down and take further action to add more detail to any opportunity, move it through the sales process or schedule to follow up. As a manager, you can view a Top 10 list for the entire team to monitor close to closing opportunities.
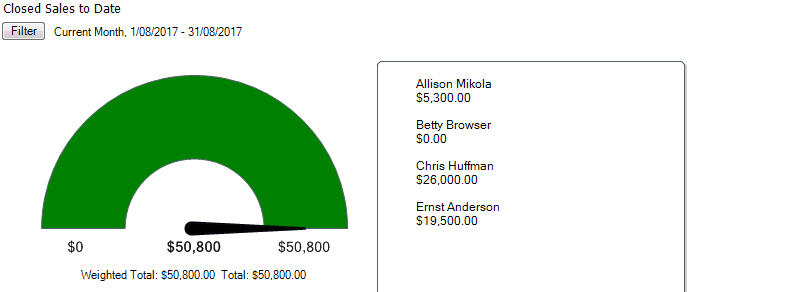
6. Closed Sales to Date
The ‘Closed Sales to Date’ component provides you with a view of all closed sales opportunities for a given date range for a quick view of your sales accomplishments. Easily see how you’re tracking toward opportunity goals with this view using the sales targets. As a manager, use this component to specify targets for your team and easily identify how they’re approaching those targets.
Act! gives you the flexibility to customise the existing dashboard or create a new one to meet the unique needs of you and your team. In addition, as a Manager or Administrator you have the ability to add or remove components, change titles or legends and utilise drag-and-drop functionality with the Dashboard Designer for easy customisation of any default dashboard or creation of new dashboards. Now you can quickly prioritise activities to optimise daily productivity and increase visibility into opportunities to improve sales.
For help using and customising the Act! Dashboard, contact us on 1300 362 046.